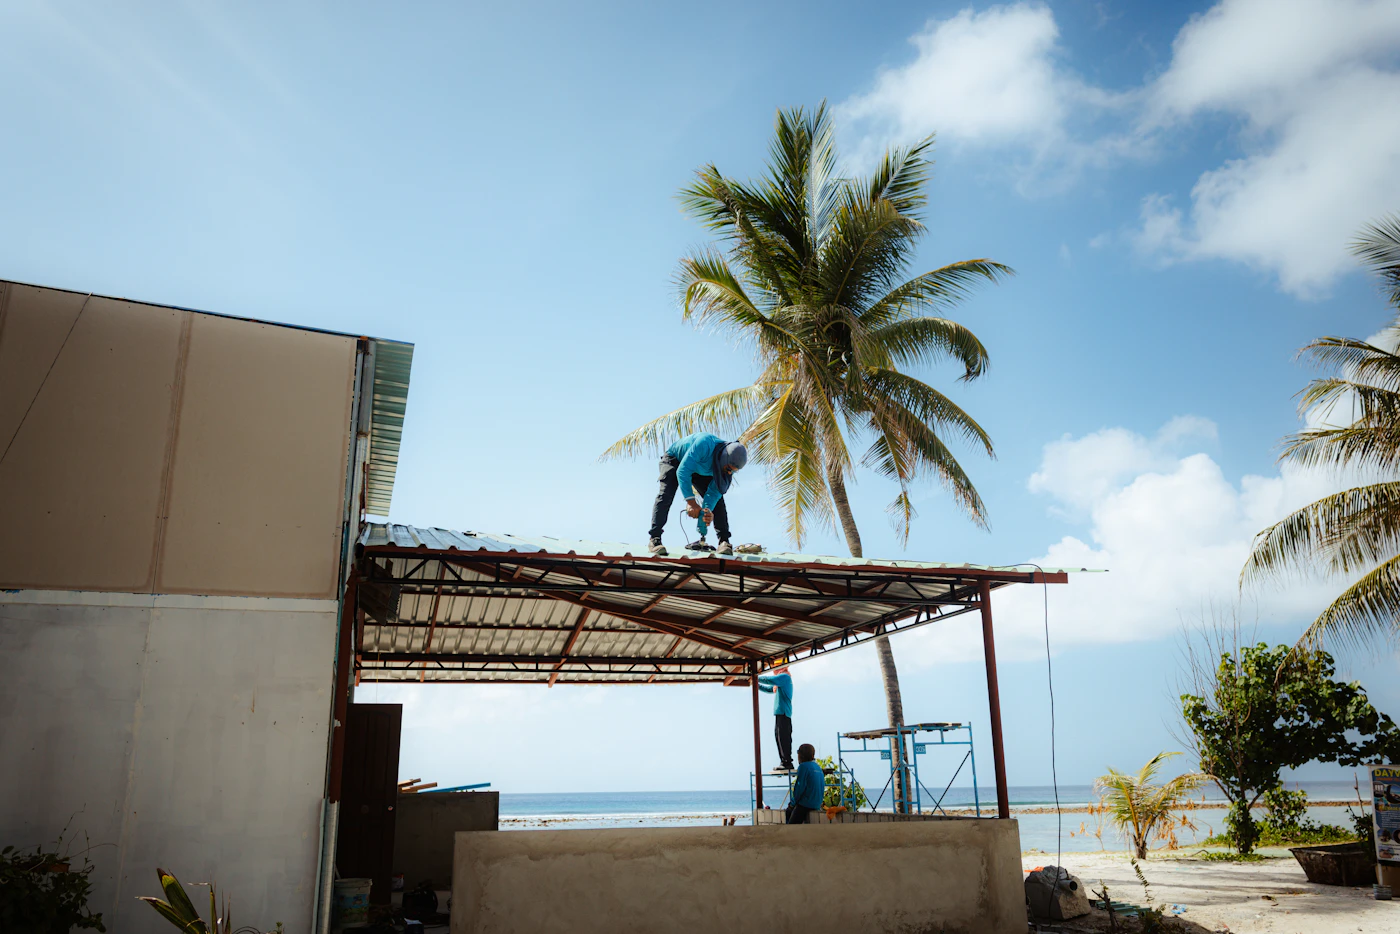
Contractors installing a metal roof on a beachside structure
Data report · OSHA Injury Tracking Application · Updated October 9, 2026

Workplace injury rates by industry and state

Injuries serious enough to miss work or move to restricted duty, per 100 full-time workers, for construction, restaurants, trucking, warehouses, nursing homes and janitorial and landscaping firms in every state, from the 2025 Form 300A summaries employers filed with OSHA. Sortable, downloadable and free to cite.

Warehouses reported the highest serious-injury rate of six high-risk industries: 3.7 injuries or illnesses serious enough to keep a worker off the job, on restricted duty or transferred per 100 full-time workers in 2025, against 2.3 across all 366,514 establishments in OSHA’s 2025 injury reports. Construction reported the lowest of the six, 1.2. These are reports from larger employers in high-hazard industries, not every workplace.

By Sam Alishahi, independent insurance broker · 2025 summaries submitted through August 31, 2026

2025 Form 300A summaries

What employers reported to OSHA, nationwide

366,514establishments with 43,290,843 average employees in the data
862,176injuries and illnesses serious enough to miss work, restrict duty or transfer, 2.3 per 100 full-time workers
37.1days away from work per case, on average
774work-related deaths recorded, 184 of them in construction
By industry

Warehouses report the most serious injuries, construction the fewest

Cases with days away from work, restricted duty or job transfer (DART) per 100 full-time workers, 2025, nationwide.

Serious workplace injuries by industry: DART cases per 100 full-time workers, 2025Warehouses3.7Nursing homes3.5Trucking2.9Restaurants and bars2.4Janitorial and landscaping2.1Construction1.2All establishments in the file2.3
IndustryEstablishmentsAverage employeesSerious cases per 100 workers (DART)All recorded cases per 100 workersDays away per caseDeaths reported
Warehouses (NAICS 4931)8,9381,635,9273.74.238.914
Nursing homes (NAICS 6231)8,8581,104,4553.55.121.22
Trucking (NAICS 484)8,386603,4632.93.744.848
Restaurants and bars (NAICS 722)9,651419,0702.44.031.73
Janitorial and landscaping (NAICS 5617)8,484566,2082.13.234.016
Construction (NAICS 23)37,7893,367,8681.22.039.7184
All establishments in the file366,51443,290,8432.33.637.1774

What the data shows

Warehouses and nursing homes report the most serious injuries. In 2025, warehouses reported 3.7 cases with days away, restricted duty or a job transfer per 100 full-time workers and nursing homes 3.5, against 2.3 across every establishment that filed. Then came trucking companies (2.9), restaurants and bars (2.4), janitorial, landscaping and building-services firms (2.1) and construction sites (1.2).

Construction recorded the most deaths of the six. Employers in construction recorded 184 work-related deaths on their 2025 summaries, 24% of the 774 in the file.

Trucking injuries keep people off work longest. A trucking case with days away averaged 44.8 days off the job, against 37.1 across the file and 21.2 in nursing homes. In trucking, 70% of serious cases were days away from work; in warehouses, 64% were restricted duty or a job transfer instead.

The same industry reports very different rates from state to state. Construction rates run from Vermont (3.8) and Hawaii (2.6) down to Louisiana (0.2), and 31 of 51 states with enough hours to publish are above the national 1.2. In warehouses, the range is Maine (8.1) to New Mexico (1.4). Low rates reflect what employers recorded, which also depends on how cases are reported and how quickly injured workers return to modified duty.

California employers reported higher rates than the nation in 5 of 6 industries. Warehouses: 4.7 in California, 3.7 nationally; Nursing homes: 3.4 in California, 3.5 nationally; Trucking: 3.2 in California, 2.9 nationally; Restaurants and bars: 3.7 in California, 2.4 nationally; Janitorial and landscaping: 3.2 in California, 2.1 nationally; Construction: 1.9 in California, 1.2 nationally. Across all industries, California establishments reported 3.1 (rank 8 of 51).

By broad sector, transportation and warehousing reports the highest rate. Transportation and warehousing establishments reported 4.5 serious cases per 100 full-time workers, then arts, entertainment, and recreation (3.8), public administration (3.2), retail trade (2.8).

What this means for workers’ comp

Workers’ compensation is priced by job classification, so the injury history of an industry is built into what every employer in it pays, and each employer’s own claims then move its price through the experience modification (what an experience mod is). The cases counted here, injuries serious enough to keep someone off the job or on light duty, are the ones that usually become lost-time claims, which weigh far more than medical-only claims. Bringing an injured worker back on modified duty instead of sending them home is one of the few levers an employer controls. For the industries in this report: contractors, restaurants and restaurant workers’ comp, trucking, warehouses, nursing homes, janitorial and landscaping; and workers’ compensation generally, including workers’ comp in Los Angeles.

Use this chart

Free to use with a link back. Paste this into your page or article:

Construction

The 15 states with the highest construction injury rates

DART cases per 100 full-time workers reported by construction establishments (NAICS 23), 2025, against the national figure.

Construction DART rate by state: Top 15 states, 2025Vermont3.8Hawaii2.6Maine2.6New Hampshire2.5Connecticut2.2Nevada2.2Montana2.2Washington2.1Rhode Island2.0California1.9South Dakota1.8Oregon1.7Massachusetts1.7Idaho1.6Illinois1.6United States1.2
Every state

Injury rates by state and industry, sortable

DART cases (days away, restricted duty or job transfer) per 100 full-time workers, 2025. Click a column to sort. A dash means the state had fewer than 2,000,000 hours worked or 10 establishments in that industry, or one establishment carried most of the hours, so no rate is published (38 of 306 state-industry cells).

StateAll industriesConstructionRestaurants and barsTruckingWarehousesNursing homesJanitorial and landscaping
Alabama1.80.82.32.62.84.12.6
Alaska2.30.71.64.8——0.8
Arizona2.31.02.13.04.02.22.5
Arkansas1.50.91.31.32.43.91.1
California3.11.93.73.24.73.43.2
Colorado2.61.32.83.64.54.32.0
Connecticut3.12.22.85.24.94.12.6
Delaware2.41.3—2.24.15.42.0
District of Columbia2.01.52.3————
Florida2.41.52.22.43.52.72.2
Georgia2.01.02.02.52.63.62.7
Hawaii3.22.62.4——2.82.2
Idaho2.71.6—3.9—4.62.0
Illinois2.51.63.03.63.84.02.3
Indiana2.00.91.63.12.63.71.7
Iowa2.21.4—2.53.64.51.6
Kansas2.21.11.53.74.02.72.7
Kentucky2.21.21.62.42.43.21.5
Louisiana1.00.21.11.72.81.31.1
Maine4.22.6—3.18.19.6—
Maryland2.71.42.64.74.64.61.8
Massachusetts2.31.72.54.74.23.52.1
Michigan2.11.32.13.03.33.31.7
Minnesota2.01.41.73.15.25.02.6
Mississippi1.70.61.52.42.02.01.7
Missouri2.21.01.63.23.83.32.1
Montana3.12.2———4.6—
Nebraska2.01.4—2.72.52.41.5
Nevada3.02.23.22.34.33.42.7
New Hampshire2.52.5—4.32.74.33.4
New Jersey2.01.32.74.03.44.32.2
New Mexico2.01.3—2.91.42.51.6
New York2.51.22.54.46.23.82.1
North Carolina1.91.01.63.12.82.91.7
North Dakota1.61.6—1.61.72.6—
Ohio1.70.91.63.02.42.91.4
Oklahoma2.11.12.12.43.24.31.0
Oregon3.11.72.63.86.75.72.1
Pennsylvania2.41.62.23.83.63.8—
Rhode Island2.72.04.1——4.12.6
South Carolina2.01.32.32.62.43.42.2
South Dakota2.21.8—3.6—4.6—
Tennessee2.11.21.92.72.23.02.8
Texas2.00.72.22.33.42.11.9
Utah1.90.81.11.84.32.82.3
Vermont3.13.8—————
Virginia2.21.22.32.33.92.91.7
Washington3.42.12.43.97.95.73.2
West Virginia2.10.7—3.23.79.21.3
Wisconsin2.11.32.02.64.63.62.4
Wyoming2.30.9—2.5—5.7—
Every sector

Injury rates by industry sector

All establishments in the file, by two-digit NAICS sector, 2025, nationwide.

Sector (NAICS)EstablishmentsSerious cases per 100 workersAll recorded cases per 100 workersDays away per caseDeaths reported
Transportation and warehousing (48-49)40,0864.55.545.6140
Arts, entertainment, and recreation (71)3,5513.85.930.69
Public administration (92)7,5513.25.743.735
Retail trade (44-45)57,9562.84.532.139
Accommodation and food services (72)16,0992.84.433.924
Agriculture, forestry, fishing and hunting (11)4,8232.74.229.220
Wholesale trade (42)29,7022.73.539.747
Health care and social assistance (62)45,2352.24.630.540
Real estate and rental and leasing (53)11,0742.03.337.012
Other services (81)7,2671.93.034.814
Administrative and support and waste management (56)25,2701.82.737.339
Manufacturing (31-33)60,2671.72.634.5139
Utilities (22)6,8221.32.044.719
Educational services (61)2,8571.23.132.43
Construction (23)37,7891.22.039.7184
Information (51)2,2880.71.064.83
Professional, scientific, and technical services (54)4,7060.51.225.93
Mining, quarrying, and oil and gas extraction (21)8590.40.761.63
Management of companies and enterprises (55)1,5240.30.540.81
Finance and insurance (52)7710.20.631.30

Method and source

Who must file

Not every workplace is in this data. OSHA requires electronic submission of the Form 300A annual summary only from establishments with 250 or more employees in industries that must keep injury records, and from establishments with 20 to 249 employees in designated industries with historically high injury rates. Many smaller employers, and employers in low-hazard industries, are not required to file, though some file anyway. OSHA notes the data may not be generalizable to all workplaces, so the rates here describe injuries reported by larger employers in high-hazard industries, not every worker in a state or industry. The file includes states that run their own OSHA-approved plans, such as California.

Source and cleaning

OSHA’s Injury Tracking Application establishment-specific data, 2025 Form 300A summary file (submissions through August 31, 2026; 400,288 rows). We count each establishment once, keeping its latest submission; drop 21,141 rows with no hours or employees, or with hours worked per employee outside 500 to 4,000 a year, and 59 rows reporting more serious cases than employees; and leave out territories and military addresses. Some employers file the same company-wide hours on every site’s form; where one employer’s rows repeat the same employees and hours, we count those hours once: identical rows count as one filing, and otherwise the hours are split evenly across the sites (25,550 rows affected). That leaves 366,514 establishments.

Rates

The DART rate is (cases with days away from work + cases with job transfer or restriction) × 200,000 ÷ hours worked, which is cases per 100 full-time workers (100 workers × 40 hours × 50 weeks). The total case rate adds other recordable cases. Days away per case uses only rows whose days fit OSHA’s 180-day cap per case. Industries are grouped by NAICS code: construction 23, restaurants and bars 722, trucking 484, warehousing and storage 4931, nursing homes 6231, and services to buildings and dwellings 5617 (janitorial, landscaping, pest control and similar); these codes are the same in the 2012, 2017 and 2022 NAICS editions employers report under. A state-industry rate is published only where the establishments worked at least 2,000,000 hours (about 1,000 full-time workers), there are at least 10 establishments, and no single establishment worked more than half the hours. Deaths are work-related deaths employers recorded on their summaries. We publish industry and state totals only and do not name employers.

Free to use. Please cite “Alishahi Insurance analysis of OSHA injury data” and link to this page. Download every state and industry: CSV. Questions about the data: sam@alishahiinsurance.com.

Employers

Have your workers’ comp shopped across markets.

Send your class codes or a description of the work, estimated payroll and your loss runs. Outside California, requests are handled together with a partner agency in your state.

Get a quote

Tell me how to reach you. I’ll take it from there.

Takes about 30 seconds. I review every request personally and call you back, usually the same day.

(424) 552-4545

Answered 24/7 · CA License #4348151

Only your name, phone and email are required; every question here is optional. Sending this form doesn’t bind coverage; coverage starts only when I confirm it in writing.

Not shopping yet?

Get a reminder before your renewal.

Tell me when your policy renews and I’ll email you about six weeks before, when it’s worth comparing. One email, no calls.