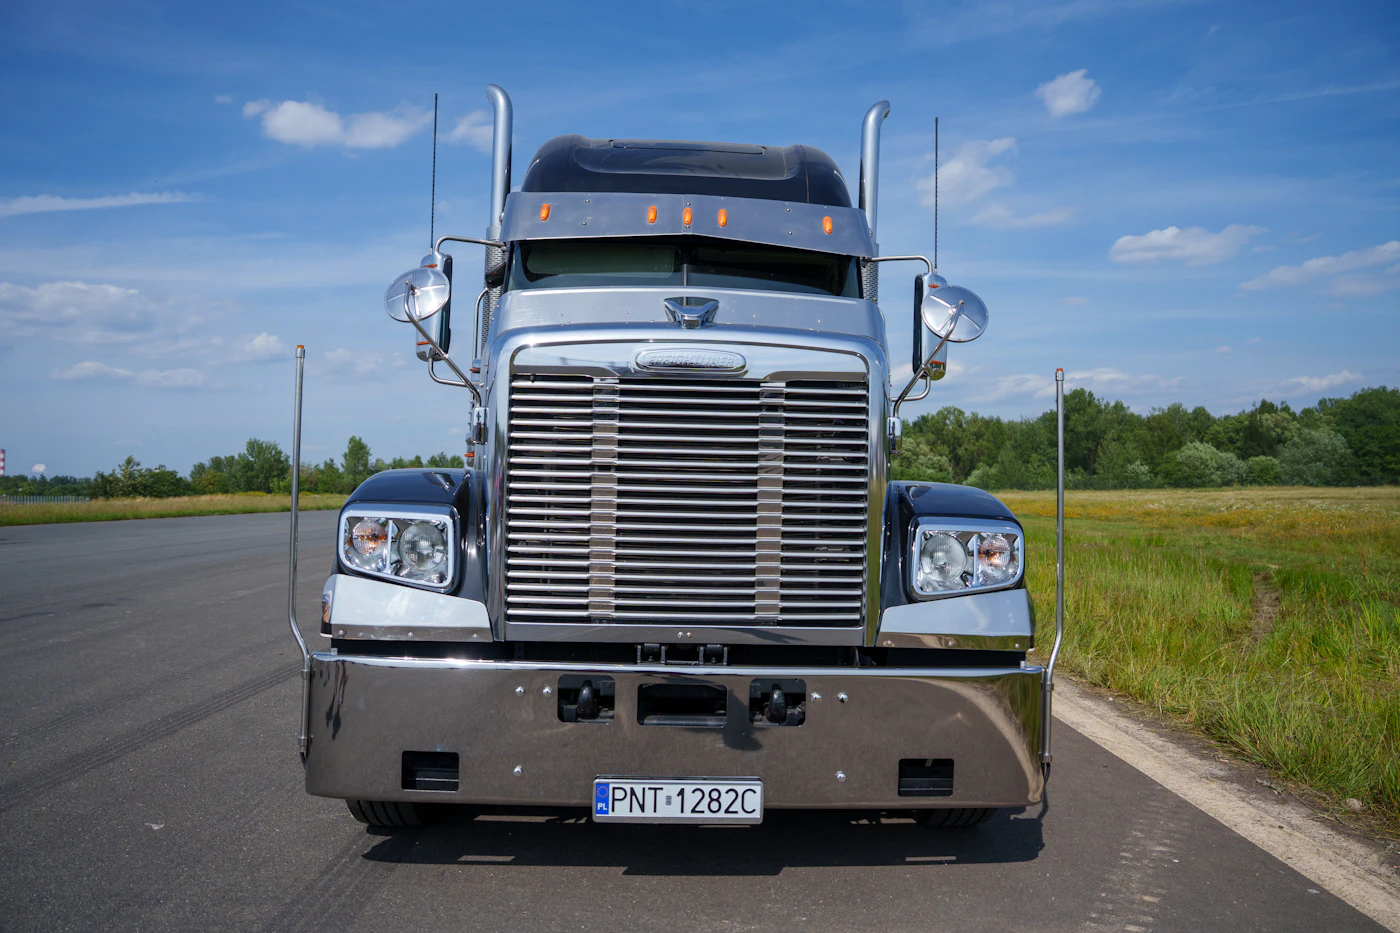
Semi truck on an open highway
Data report · FMCSA Vehicle Inspection File · Updated October 4, 2026

Truck inspections and out-of-service rates by state

Every roadside inspection of a truck or bus recorded by FMCSA in 2025, by state and inspection level, with the share of vehicles and drivers placed out of service. Refreshed from the source, sortable, downloadable and free to cite.

Minnesota has the highest truck out-of-service rate: 40.4% of vehicles inspected there in 2025 were ordered off the road until repaired, against 22.3% nationwide; Mississippi had the lowest (11.5%). California did the most roadside inspections (442,328), and 6.1% of drivers inspected nationwide were placed out of service.

By Sam Alishahi, independent insurance broker · Data through 2026-10-01

2025, the latest complete year

Roadside inspections, nationwide

2,772,468roadside inspections of trucks and buses recorded in 2025
22.3%of vehicles inspected (Levels I, II and V) placed out of service, up from 21.6% in 2024
6.1%of drivers inspected (Levels I, II and III) placed out of service
31%of inspections happened in California, Texas and New York
By state

The 15 states with the highest vehicle out-of-service rates, 2025

Share of Level I, II and V inspections that found a vehicle out-of-service violation. States with at least 2,000 such inspections.

Vehicle out-of-service rate, 2025, top 15 statesMinnesota40.4%Nebraska40.1%South Carolina36.5%Wyoming35.4%Iowa33.9%Connecticut33.4%Arkansas33.3%Utah33.3%Tennessee33.1%Washington32.4%Oregon31.6%Delaware30.7%Missouri30.2%South Dakota30.2%Wisconsin28.3%
By state

The 15 states that inspect the most trucks and buses

Roadside inspections recorded in 2025, by the state where they happened.

Roadside inspections, 2025, top 15 statesCalifornia442,328Texas315,057New York114,118North Carolina109,981New Mexico92,708Florida87,282Tennessee86,591Maryland80,315Pennsylvania79,201Georgia76,729Illinois62,971Ohio62,783Washington61,040Kentucky56,682Missouri55,443
Why trucks are stopped

The most common out-of-service violations, 2025

Among the 60 most frequent out-of-service violations recorded in 2025 (611,685 citations), the leading types were tires (25%), brakes (22%), lights (17%), driver’s licenses (9%), cargo securement (8%). Each row below is one violation code; the same defect can be cited on a truck and its trailer.

#ViolationTypeCode (49 CFR)Out-of-service citations
1All others, leaking or inflation less than 50% of the maximum inflation pressure on tire not equipped with ATISTires393.75A3-TAOL95,171
2Defective brake(s) are equal to or greater than 20% of the service brakes on the vehicle/combinationBrake396.3A1-BOS38,975
3Operating a property-carrying vehicle without a valid medical certificate in possession or on file with the state drivers licensing agencyMedical (Certificate)391.41APC33,951
4Turn signal - Any inoperative on the rearmost vehicle.Lighting393.9A-LTSI31,821
5Operate a CMV and does not possess a valid CDLLicense (CDL)383.23A2-LCDLN28,798
6Failing to have a record of duty status using the method prescribedHOS (Property)395.8A1-HOSP27,972
7Stop lamps - Both inoperative when required to be onLighting393.9A-LSLIWR23,333
8Tire-flat and/or audible air leakTires393.75A322,990
9Hose/tubing damage into the outer reinforcement ply.Air Brake393.45B2-BHTD21,302
10Cargo not secured to prevent leaking/spilling/blowing/falling from CMVCargo393.100B-C15,026
11Operating a CMV without a CDLDriver’s licenses383.23A213,222
12Vehicle components or dunnage not securedCargo392.9A2-C13,205

What the data shows

About one vehicle in 4 inspected is ordered off the road. In 2025, 22.3% of Level I, II and V inspections found a vehicle out-of-service violation, a defect serious enough under the CVSA out-of-service criteria that the truck can’t move until it’s repaired. 6.1% of driver inspections put the driver out of service.

Rates vary widely by state. The highest vehicle out-of-service rates were in Minnesota (40.4%), Nebraska (40.1%), South Carolina (36.5%), Wyoming (35.4%), Iowa (33.9%); the lowest in Mississippi (11.5%), Kansas (11.5%), West Virginia (13.4%), New Mexico (13.9%), District of Columbia (15.1%). For drivers, the highest rates were in Oregon (15.7%), Wyoming (14.3%), Massachusetts (13.7%). Rates also reflect how each state inspects, such as which inspection levels it uses and which vehicles it selects, so they measure enforcement as well as the condition of the trucks.

Most inspections are not the full Level I. Of 2,772,468 inspections in 2025, 24% were Level I, 36% Level II walk-arounds and 37% Level III driver-only checks (what each level covers).

California recorded 442,328 inspections, rank 1 of 51, with a vehicle out-of-service rate of 15.5%.

For a trucking company, every inspection lands on its FMCSA record. Out-of-service violations weigh heavily in the Safety Measurement System behind CSA scores, and underwriters read the same inspection history when they price a renewal. Check any carrier’s inspection record by USDOT number (how CSA scores work; truck insurance; truck crashes by state).

Use this chart

Free to use with a link back. Paste this into your page or article:

All states

Every state, sortable

Click a column to sort. Ranked by inspections in 2025. Rates shown for states with at least 2,000 qualifying inspections. *2026 through October 1.

RankStateInspections 2025Vehicle OOS rate 2025Driver OOS rate 2025Level I inspectionsVehicle OOS rate 2024Inspections 2026 so far*
1California442,32815.5%3.2%172,61814.6%345,265
2Texas315,05725.4%5.2%86,72824.2%310,986
3New York114,11820.6%9.9%17,46021.1%74,521
4North Carolina109,98118.4%3.9%16,34820.1%80,208
5New Mexico92,70813.9%3.0%16,81515.1%67,713
6Florida87,28225.6%5.9%12,40424.9%66,289
7Tennessee86,59133.1%6.3%36,60330.2%66,005
8Maryland80,31518.4%8.4%20,44817.1%56,089
9Pennsylvania79,20122.8%8.2%19,86522.7%65,963
10Georgia76,72926.5%10.6%12,47025.0%55,999
11Illinois62,97115.4%4.1%5,19514.5%52,103
12Ohio62,78321.7%5.6%8,58022.3%44,646
13Washington61,04032.4%5.4%8,58538.3%54,996
14Kentucky56,68227.0%4.7%22,65124.3%42,940
15Missouri55,44330.2%6.6%13,49525.6%45,416
16Indiana54,10422.0%6.4%6,05222.2%39,392
17South Carolina53,33736.5%5.4%7,28336.1%41,255
18Arizona52,36725.1%12.5%10,90427.1%40,155
19New Jersey50,49116.8%7.4%14,29817.2%38,704
20Colorado49,26421.1%6.4%8,34320.8%36,271
21Arkansas46,26733.3%6.4%7,00333.9%31,765
22Michigan44,03926.9%8.1%7,13426.3%34,746
23Alabama43,56223.6%6.8%4,72221.1%35,471
24Mississippi43,52911.5%6.6%8,58310.2%30,607
25Louisiana42,21226.3%4.7%5,75722.8%36,538
26Iowa36,05633.9%8.6%4,89831.1%25,880
27Utah35,63333.3%5.6%12,13430.6%27,596
28Kansas34,44511.5%5.1%5,01213.6%25,114
29Wisconsin34,17728.3%6.7%8,41628.6%25,066
30Oklahoma32,99623.7%5.8%7,82825.6%24,966
31Montana30,10521.9%5.7%4,10721.7%22,047
32South Dakota29,61430.2%3.7%3,30130.7%21,145
33Massachusetts28,08523.3%13.7%2,93622.3%17,741
34Minnesota27,56040.4%7.4%8,29038.6%21,274
35Nebraska24,84740.1%4.2%2,82241.8%17,296
36Virginia22,60325.0%8.1%6,01027.2%19,197
37Nevada22,29818.0%5.8%2,98017.6%17,676
38Connecticut20,81133.4%10.0%4,48032.3%11,860
39Oregon19,50931.6%15.7%4,55730.8%16,399
40West Virginia18,89413.4%6.1%1,97412.2%15,304
41Maine14,52917.5%5.9%4,05816.8%10,790
42Wyoming14,44135.4%14.3%6,41537.6%11,171
43North Dakota11,01619.9%3.3%2,30417.6%9,306
44Idaho10,57024.3%8.5%3,94821.0%8,353
45Vermont8,57824.9%6.2%1,34324.4%6,513
46New Hampshire8,53919.0%8.0%1,35315.2%6,727
47Delaware7,99330.7%6.2%1,47534.0%6,407
48Alaska7,68121.5%4.2%1,89618.1%5,364
49Rhode Island3,402—11.4%997—3,336
50District of Columbia3,37415.1%6.8%98313.8%4,102
51Hawaii2,311—6.4%1,229—1,887

Method and source

All figures come from FMCSA’s Vehicle Inspection File on the Department of Transportation’s open data portal, one record per roadside inspection, queried through its public API (inspections dated through 2026-10-01). States are where the inspection happened. Following FMCSA’s convention, the vehicle out-of-service rate is the share of Level I, II and V inspections (the levels that examine the vehicle) with at least one vehicle out-of-service violation, and the driver out-of-service rate is the share of Level I, II and III inspections (the levels that examine the driver) with at least one driver out-of-service violation. Rates are shown for states with at least 2,000 qualifying inspections. Territories are excluded; the District of Columbia is included. The most common out-of-service violations come from FMCSA’s companion Vehicle Inspections and Violations file, counted by violation code for records entered in 2025; that file has no inspection date, so the entry date is used.

Free to use. Please cite “Alishahi Insurance analysis of FMCSA inspection data” and link to this page. Download every state, year and inspection level: CSV. Questions about the data: sam@alishahiinsurance.com.

Run trucks?

Clean inspections help your renewal. Let me shop it.

Your USDOT number, drivers, units and loss runs are enough to start. Outside California, requests are handled together with a partner agency in your state.

Get a quote

Tell me how to reach you. I’ll take it from there.

Takes about 30 seconds. I review every request personally and call you back, usually the same day.

(424) 552-4545

Answered 24/7 · CA License #4348151

Only your name, phone and email are required; every question here is optional. Sending this form doesn’t bind coverage; coverage starts only when I confirm it in writing.

Not shopping yet?

Get a reminder before your renewal.

Tell me when your policy renews and I’ll email you about six weeks before, when it’s worth comparing. One email, no calls.